
Know what moved sales.
Anticipate what comes next.
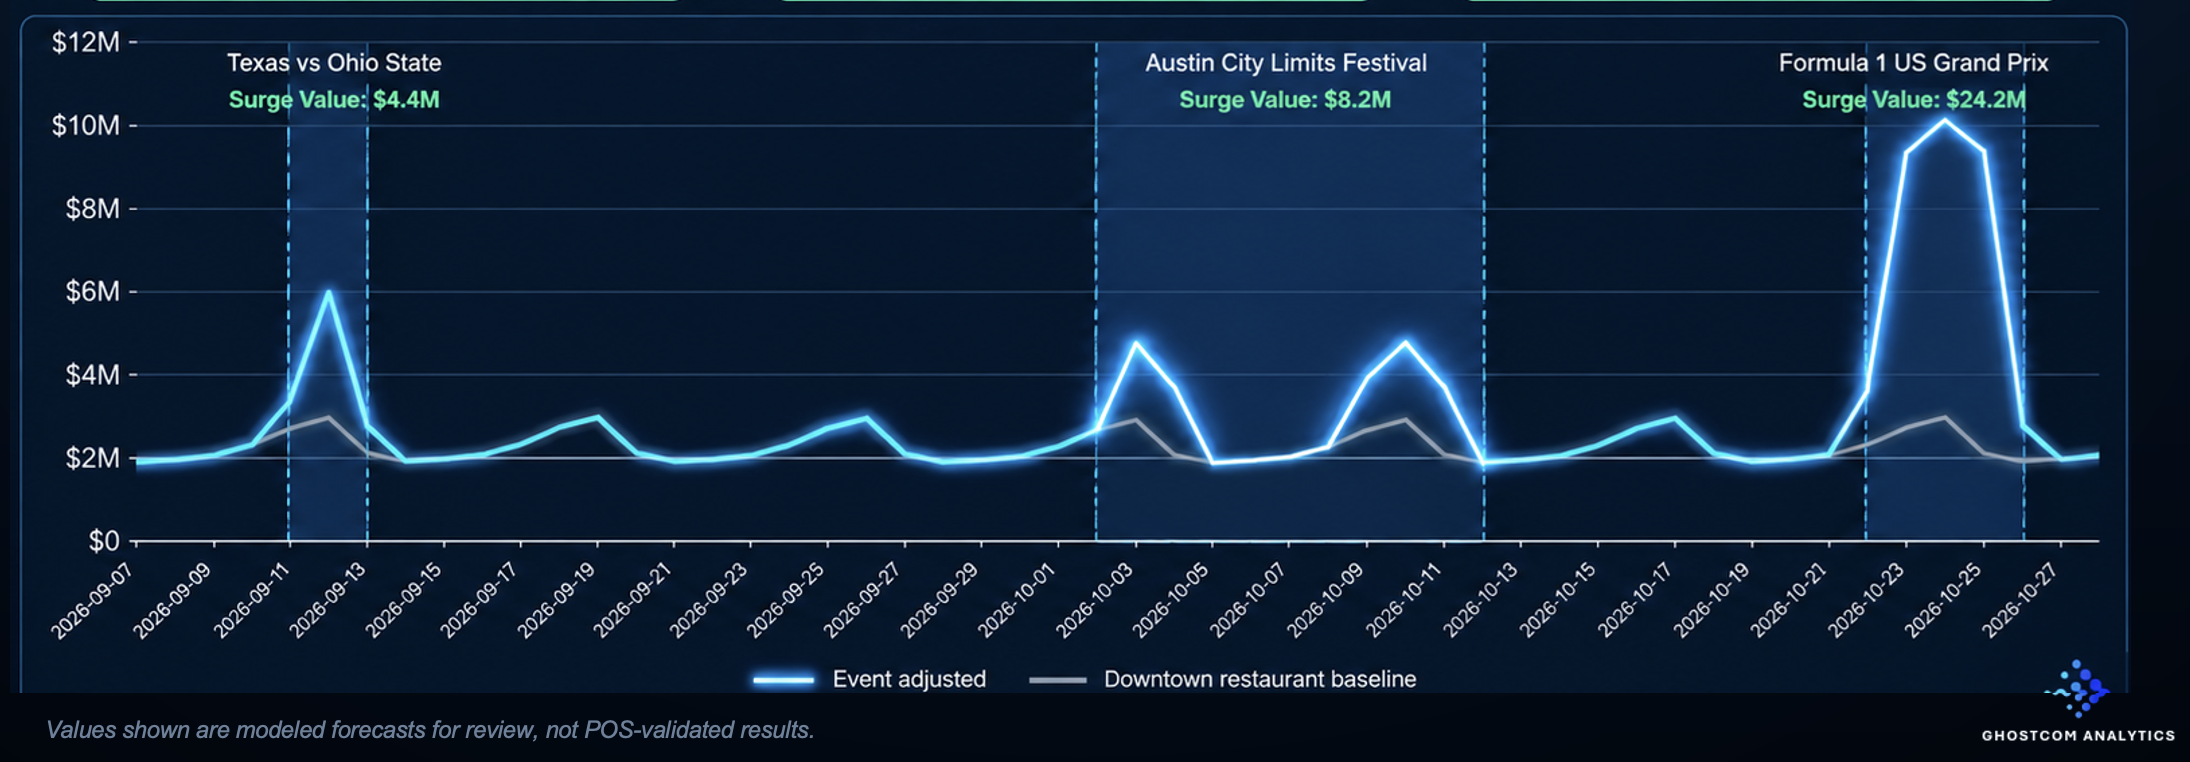
Events and weather move consumers and dollars into specific places for specific windows of time, lifting some sectors while cutting others. GhostCom Analytics forecasts those surges by ZIP, DMA and sector, so you capture the demand instead of finding out it was there after it's gone.
$1.34 Billion
In Hurricane Isaias Sales Impact setting Q4 off to a tough start in the south
+1.3%
Tailwind for restaurants in Q4
Breakdown macroeconomic environment, weather impacts and surge events helping or impeding Y/Y sales growth rates
Stop Reacting. Start Predicting the Surge.
GhostCom Analytics is able to pull in the macroeconomic, weather, and surge events that can drive sales growth or pull Y/Y sales down. Our reports and systems provide historical recaps of these drivers and forecasts of headwinds and tailwinds for sales growth in upcoming quarters. We cover retail, restaurants and travel sectors with specific views from national to state to market and event ZIP codes. Our goal is to provide you with next generation market intelligence so you can target and take advantage of days and locations that have the best sales potential, and avoid wasting resources on low potential days and markets.
An event that pulls consumers and their spending into a defined geography for a defined window of time. A convention, a festival, a home game, a race weekend. Spending in that trade area rises sharply, then returns to baseline.
Environmental Sales potential measures the weather impacts on sales. Major events such as Hurricanes, winter storms, wild fires, etc. have dramatic impacts on sales across sectors. We quantify these impacts on sales within 24 hours of an event.
Isaias (landfall Fri Oct 9) is the dominant Q4 weather event so far: 161 counties and 10.4M people in reach, with the classic prep-hit-recovery arc.
Thu Oct 8 as the Gulf stocked up.
Sat Oct 10: −49% on peak day in Mobile-Pensacola.
Two weeks back to normal: −2% by Oct 24.
Comps run easy from here: mild easy weather comps most of the next 90 days (+0.9 to +1.3 pp net for QSR and fast casual), with the big laps late Nov–mid Dec as 2025’s winter storms roll off.
Click chart to enlarge
GhostCom Analytics Intelligence
Offers sector specific coverage of macroeconomic, weather and surge events for the retail, restaurant and travel sectors.
Monthly Sector Intelligence
A standardized monthly report and data sheet for each subscribed sector.
Subscribers receive
- i.Monthly 90 day recap and 90 day outlook reports
- ii.Weekly alerts for major events impacting you sector
- iii.Interactive user interface access
- iv.API data feed
Sectors available
* SurgeCast content only.
Key use cases
- a.QBR and earnings support explaining the macro / weather / events that impacted Y/Y sales growth.
- b.Forecasts projecting where and when sales potential is likely to surge based on macro/weather and event factors.
- c.Deploy retail teams to the areas that are about to see a sales surge.
- d.Deploy marketing and advertising to areas that are about to experience sales surges.
We know spending
Our founders spent more than two decades building consumer-spending intelligence infrastructure.
20+ years reading the economy
We built one of the most widely cited consumer-spending indices in the United States, and have spent more than two decades turning spending data into numbers decision-makers can act on.
- Macro to localfrom national spending indices down to ZIP-level, day-by-day forecasts
- Trustedby government, policymakers, financial institutions, retailers and the media
We spent 20+ years studying the macro trends in consumer spending. Then we discovered the power of
The games, conventions, festivals and storms that move demand, market by market and day by day, long before they show up in the macro numbers.
Let’s get started
Learn more about our services & get sample reports for your sector.